Is Mount Coot-tha expensive?
There is not yet enough consistent market data for a dependable house median. The nearby suburb links make it easier to compare the wider market while local observations build.

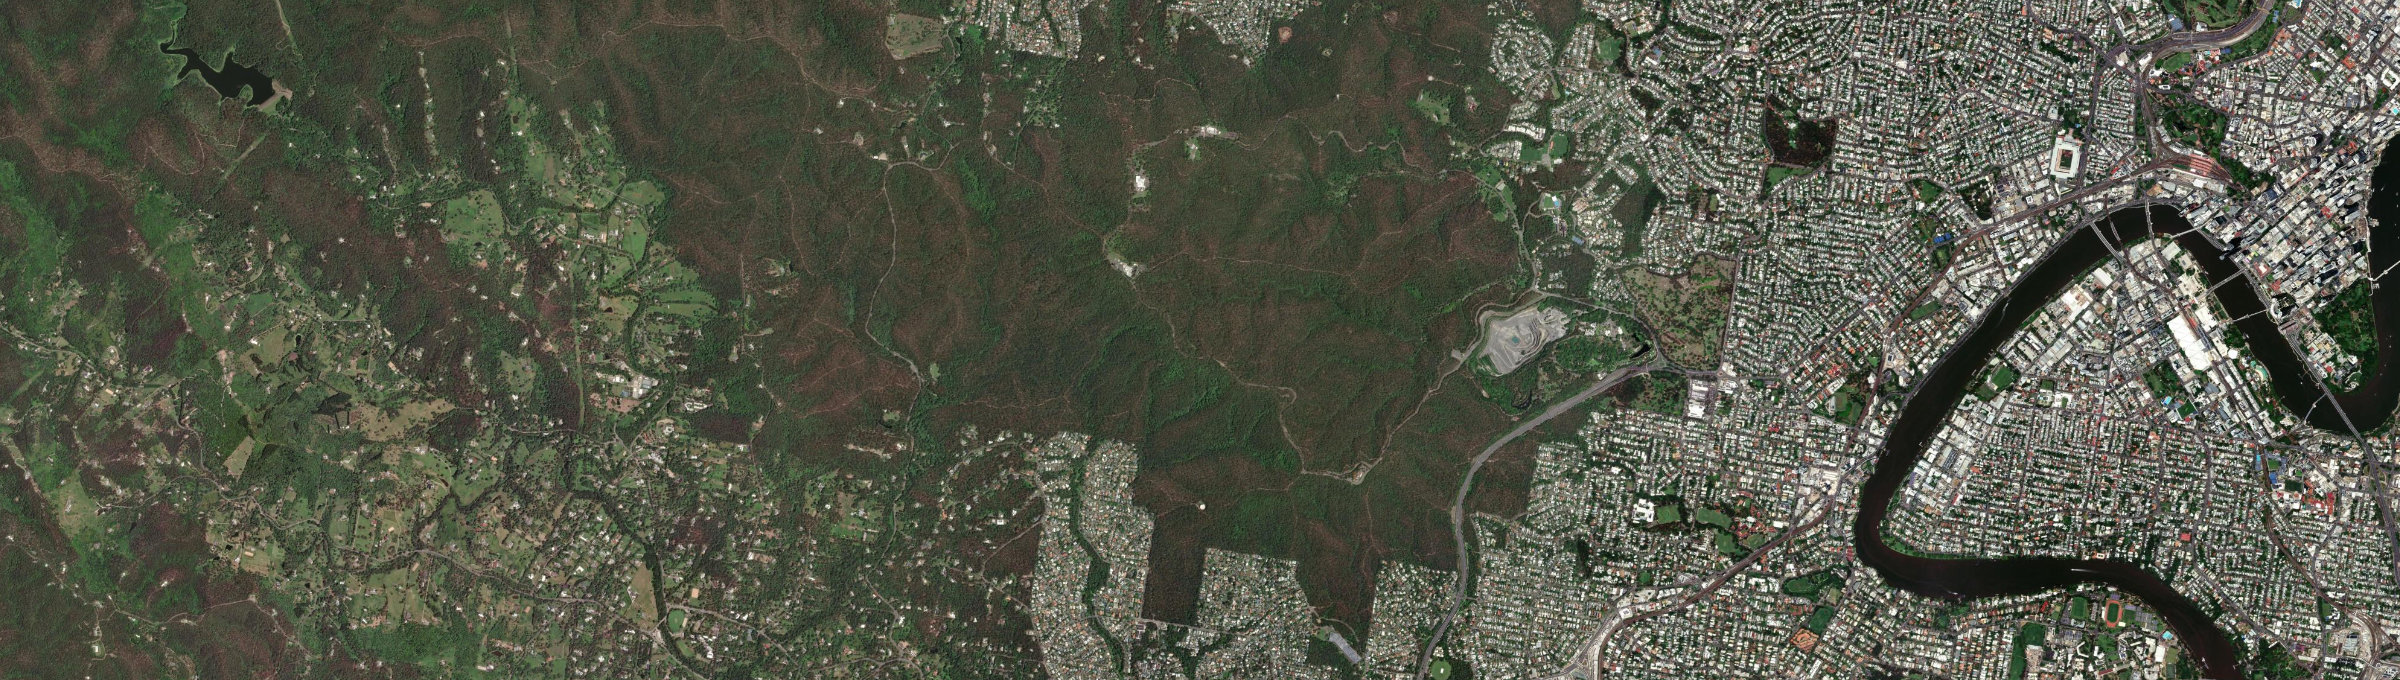
Aerial view
The quick read on
QLD 4066 · Brisbane
What homes cost, how rents have moved, and a feel for the people who call it home.
ABS 2021
Mount Coot-tha, Queensland
Median sale price and rental income of properties in Mount Coot-tha QLD
Crime and safety
The overall rate for Mount Coot-tha is 2,292 offences per 100,000 residents — 86% above the Greater Brisbane benchmark.
That is the clearest suburb-wide answer. Open the detailed profile to see how the pattern changes across offence types and different parts of Mount Coot-tha.
Overall crime rate
2,292
offences per 100,000 residents
86% aboveGreater Brisbane
Suburb-wide estimate from Microburbs' public crime model; it is not an address-level measure.
The people behind the postcode
Mount Coot-tha QLD 4066 is in Queensland, within Greater Brisbane.
0 people call Mount Coot-tha home, with an average of 0 people per household and a median household income of $0 a week.
Public ABS 2021 Census figures. The bars compare the local share with the capital-region benchmark.
A closer look at the Census
Open any question for a plain-English reading of the public 2021 Census for Mount Coot-tha QLD 4066.
The labour-force participation rate was 0.0%, compared with 64.5% across Greater Brisbane.
Unemployment was 0.0%, compared with 5.5% across Greater Brisbane.
Labour-force figures come from the 2021 Census.
Median household income was $0 per week in the 2021 Census.
The median monthly mortgage repayment reported by local households was $0.
Occupied renting households reported a median rent of $0 per week.
These household figures are from 2021; current sale and asking-rent medians appear in the market section.
Three useful questions
There is not yet enough consistent market data for a dependable house median. The nearby suburb links make it easier to compare the wider market while local observations build.
The Census counted 0 local families. That describes the community; school quality, travel times and the right fit for a particular family need separate research.
The free data does not have a dependable bedroom breakdown for this suburb. Compare the current house and unit medians above, then use live listings to see what a $1.5m budget buys today.
Medians describe recorded market activity across the suburb; they are historical context, not a valuation or forecast for an individual home.
Explore the area
Street-by-street reports are not published yet. The streets below are the ones this suburb covers.
Compare nearby suburb prices, rents and five-year market trends.
Keep exploring
Use the finders to compare places and properties, or open the full report when you need the street, risk, schools and growth research.
Figures update as new market and census data arrives. This suburb overview is general information, not a valuation or financial advice.