Median price trend for houses
Based on 45 sales in the preceding 12 months
$1,340,000
Up 5.3% over 12 months
- 3 bed
- $1.16m
- 4 bed
- $1.17m
- 5+ bed
- $1.38m

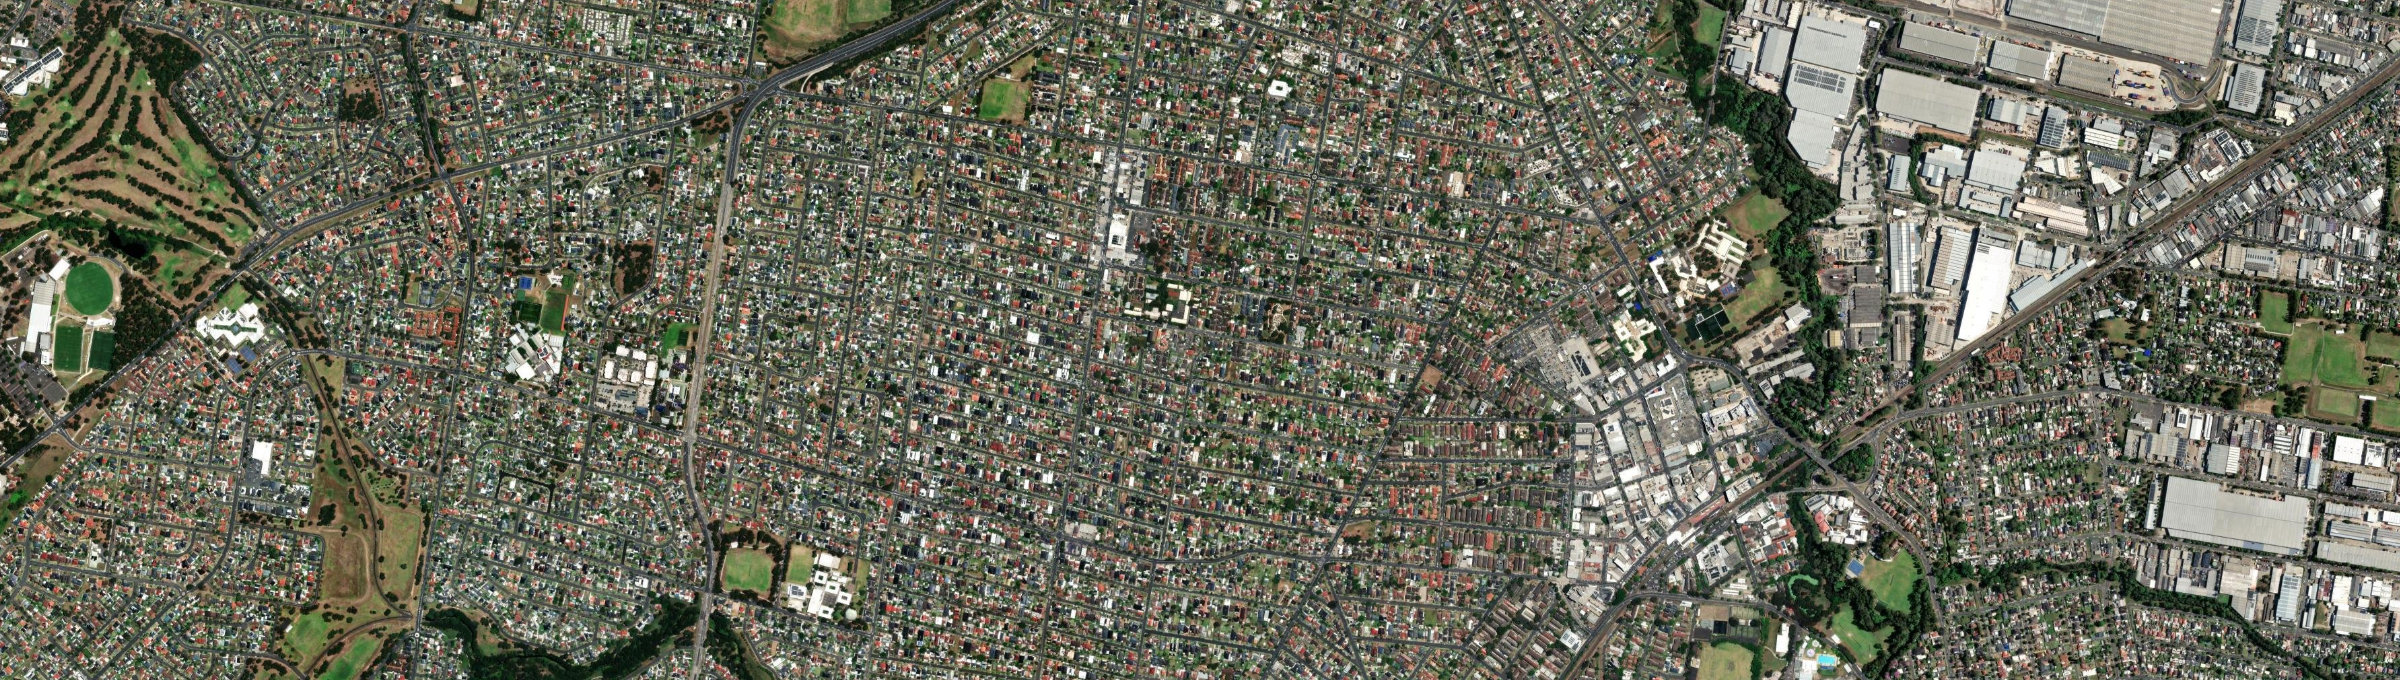
Aerial view
The quick read on
NSW 2165 · Fairfield
What homes cost, how rents have moved, and a feel for the people who call it home.
latest suburb median
latest suburb median
ABS 2021
Fairfield Heights, New South Wales
Median sale price and rental income of properties in Fairfield Heights NSW
Based on 45 sales in the preceding 12 months
$1,340,000
Up 5.3% over 12 months
Based on 67 rental listings in the preceding 12 months
$900 per week
Up 12.5% over 12 months
Market data updated October 2026.
The median house price in Fairfield Heights, NSW is currently $1,340,000, based on the latest 12 months of sales. Fairfield Heights has a 12-month growth rate of 5.3% for houses and -2.9% for units.
Three-bedroom houses have a median sale price of $1,160,000, Four-bedroom houses have a median sale price of $1,170,000, Larger houses have a median sale price of $1,380,000 in Fairfield Heights.
If you're looking to lease, the median rent for houses in Fairfield Heights is $900 per week. The median house rent has increased 12.5% over the last 12 months.
The median price of apartments and units for sale in Fairfield Heights is $840,000, which has decreased 2.9% since the same time last year. Two-bedroom apartments and units have a median sale price of $791,000, Three-bedroom apartments and units have a median sale price of $900,000 in Fairfield Heights. The median rent for units and apartments in Fairfield Heights is $625 per week and has remained unchanged over the last 12 months.
Crime and safety
The overall rate for Fairfield Heights is 3,353 offences per 100,000 residents — broadly in line with Greater Sydney.
That is the clearest suburb-wide answer. Open the detailed profile to see how the pattern changes across offence types and different parts of Fairfield Heights.
Overall crime rate
3,353
offences per 100,000 residents
In line withGreater Sydney
Suburb-wide estimate from Microburbs' public crime model; it is not an address-level measure.
The people behind the postcode
Fairfield Heights NSW 2165 is in New South Wales, within Greater Sydney.
8,269 people call Fairfield Heights home, with an average of 3.4 people per household and a median household income of $1,285 a week.
Public ABS 2021 Census figures. The bars compare the local share with the capital-region benchmark.
Share of residents in each age band.
Share of occupied private dwellings.
Share of homes with a stated ownership or rental status.
Vehicles available to occupied households.
Selected ways residents worked or travelled on Census day.
20.8% of workers in Fairfield Heights worked from home on Census day — about half the rate across Greater Sydney.
8.8% of Fairfield Heights residents were born in Vietnam, about twice the rate across Greater Sydney.
9.2% of people in Fairfield Heights described themselves as having no religion in the 2021 Census.
A closer look at the Census
Open any question for a plain-English reading of the public 2021 Census for Fairfield Heights NSW 2165.
19.8% of Fairfield Heights's residents were children under 15 in the 2021 Census. That is close to the Greater Sydney average.
2,029 family households lived in Fairfield Heights; 55.8% were couple families and 21.8% were one-parent families.
40.0% of local families included children under 15. That is close to the Greater Sydney average.
These are suburb-wide household figures, not school or childcare ratings.
Fairfield Heights had 8,269 residents at the 2021 Census.
24.8% of residents were aged 25 to 44.
28.5% were 55 or older. That is close to the Greater Sydney average.
Age shares use the suburb’s total Census population.
Separate houses made up 56.2% of occupied private dwellings in Fairfield Heights.
Townhouses and other attached homes represented 36.4% of occupied private dwellings.
Flats and apartments accounted for 6.9% of occupied private dwellings.
All three shares use occupied private dwellings as the denominator.
25.8% of households with a stated tenure owned their home outright. That is somewhat below the Greater Sydney average.
24.0% were buying their home with a mortgage.
50.2% rented their home. That is well above the Greater Sydney average.
Tenure shares include households that stated one of these three arrangements.
The average household in Fairfield Heights had 3.4 people.
One-person households made up 18.0% of occupied homes. That is somewhat below the Greater Sydney average.
Two-person households represented 20.5%, while 46.3% had four or more usual residents.
Household size counts usual residents in occupied homes.
20.8% of workers worked from home on Census day. That is about half the Greater Sydney rate.
51.5% drove a car as their only travel method. That is well above the Greater Sydney average.
2.7% used only a train, tram or bus, while 1.2% walked or cycled.
Travel figures are a 2021 Census-day snapshot.
11.4% of occupied households had no motor vehicle available. That is almost exactly typical for Greater Sydney.
One-car households formed 36.9% of the total.
51.5% of households had two or more vehicles.
Vehicle counts refer to occupied households, not individual residents.
61.2% were at the same address five years earlier, while 38.8% reported a different address.
65.2% of residents were born outside Australia. That is well above the Greater Sydney average.
Mobility figures cover residents who answered the relevant Census question.
16.3% of residents used only English at home.
76.3% used a language other than English at home.
1.7% spoke Mandarin at home, 2.1% spoke Cantonese and 0.5% spoke Hindi.
Home language is separate from English proficiency.
65.2% of Fairfield Heights's population was born outside Australia, while roughly 34.8% was born in Australia.
1.6% of residents were born in China.
0.1% were born in India, while Australian citizenship across the whole suburb stood at 68.1%.
Birthplace, citizenship and ancestry describe different parts of identity.
English ancestry accounted for 5.1% of ancestry responses in Fairfield Heights.
Australian ancestry made up 6.6% of responses.
Chinese ancestry represented 8.8% of responses.
People may nominate more than one ancestry, so these are shares of responses.
16.1% of employed residents worked in professional occupations. That is about half the Greater Sydney rate.
Managers accounted for 6.6% of employed residents, while clerical and administrative workers made up 14.2%.
Health care and social assistance employed 13.4% of workers, and education and training employed 5.7%.
Occupation and industry figures describe employed residents of the suburb.
The labour-force participation rate was 31.7%, compared with 60.0% across Greater Sydney.
13.6% of residents aged 15 and over worked full time, while 8.7% worked part time.
Unemployment was 12.2%, compared with 5.1% across Greater Sydney.
Labour-force figures come from the 2021 Census.
65.4% reported no selected long-term health condition.
5.0% reported a long-term mental health condition, including depression or anxiety.
4.5% reported asthma, 7.0% arthritis and 7.0% diabetes excluding gestational diabetes.
These are self-reported suburb-wide Census figures, not address-level health risks.
24.9% of people in the qualifications table held a bachelor degree. That is well below the Greater Sydney average.
Postgraduate degrees accounted for 4.5% of qualification responses.
Diploma-level qualifications represented 19.6%, while certificate-level qualifications represented 28.3%.
Qualification categories are reported separately and are not school ratings.
Median household income was $1,285 per week in the 2021 Census.
The median monthly mortgage repayment reported by local households was $2,167.
Occupied renting households reported a median rent of $450 per week.
These household figures are from 2021; current sale and asking-rent medians appear in the market section.
Working from home was 20.8% in Fairfield Heights, compared with 38.9% across Greater Sydney.
Outright ownership was 25.8% locally and 28.6% across Greater Sydney. That is somewhat below the Greater Sydney average.
Renting accounted for 50.2% in Fairfield Heights, against 37.1% across Greater Sydney.
Capital-region comparisons use the same Census definitions and year.
Three useful questions
The median house price is $1,340,000, while units and apartments sit at $840,000. Bedroom count, land and condition still create a wide range around those suburb medians.
The Census counted 2,029 local families, and 19.8% of residents were under 15. That describes the community; school quality, travel times and the right fit for a particular family need separate research.
Larger houses have a median around $1,380,000, the closest bedroom benchmark we hold to a $1.5m budget. Individual homes can differ substantially with block size, renovation and location.
Medians describe recorded market activity across the suburb; they are historical context, not a valuation or forecast for an individual home.
Explore the area
Street-by-street reports are not published yet. The streets below are the ones this suburb covers.
Compare nearby suburb prices, rents and five-year market trends.
Keep exploring
Use the finders to compare places and properties, or open the full report when you need the street, risk, schools and growth research.
Figures update as new market and census data arrives. This suburb overview is general information, not a valuation or financial advice.