


You are buying an address. The number on your screen describes a suburb. Between those scales sit the street, the surrounding buildings and the particular home you will own. Property research goes wrong when a useful area statistic is asked to answer a question about something smaller.
Property data granularity is the level of detail at which information is recorded, calculated or displayed. In Australian property research, that might be a region, suburb, street, mesh block or individual address. Choosing the right level matters as much as choosing the metric.
What property data granularity means
Granularity answers a practical question: what does this number actually describe? A suburb median describes a set of sales. A street estimate describes a modelled market level. A recorded sale belongs to a particular property and date.
There are several scales to check: where the original information was collected, where it was calculated and where it appears on the map. They can differ. A statistic displayed beside an address may still describe the surrounding area.
What granularity cannot tell you
A smaller map shape does not establish accuracy, freshness or completeness. Nor does a precise-looking dollar amount prove that a home was inspected. Granularity describes detail, while reliability depends on the evidence and method behind it.
A property's coordinates may be precise while its estimated value remains uncertain. Keep those ideas separate. Otherwise the certainty of the address can spill over into claims about the people living there, its condition or its future sale price.
Suburb data vs street data vs property data
Use each scale for the question it can support. Moving closer to an address should add relevant evidence, rather than merely produce a more detailed picture.
| Scale | Useful for | Cannot establish by itself |
|---|---|---|
| Region or council area | Broad market and employment context | The circumstances of a particular street |
| Suburb | Comparing markets using consistently defined measures | A fair price for every home inside the boundary |
| Street or small area | Investigating differences within a suburb | The condition or household circumstances of an address |
| Property | Checking recorded attributes, sales and address-specific estimates | Anything absent from the records or requiring an inspection |
Why a suburb median cannot value your home
A median is the middle of an ordered set of observations, averaging the central pair when needed. Its meaning depends on which transactions enter the set, the property type and the period covered.
If the mix of homes sold changes, the median can change even without equivalent movement in the value of every home. More expensive properties entering the sales sample can shift the result. That is a composition effect, not proof of a uniform increase.
Before comparing a listing with the median, check houses versus units, the dates and the sales count. Then examine comparable properties. The median gives context, but it does not adjust itself to your home's land, condition or layout.
When the broader number is the right one
Broad figures are useful for broad questions. A regional employment measure provides context for a housing market. Consistently defined suburb measures can help compare candidate locations before you inspect individual listings.
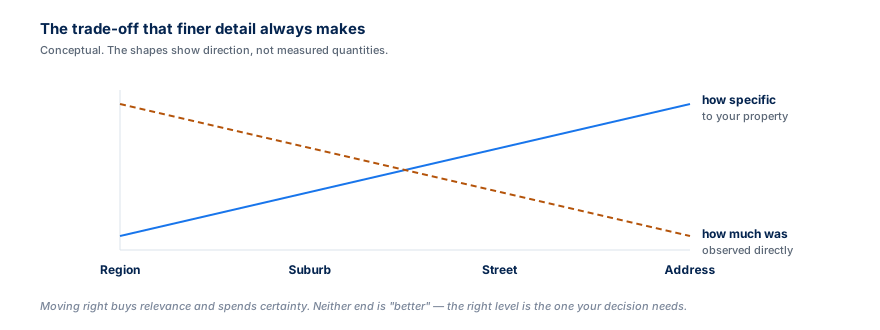
Aggregating comparable observations can also reduce the influence of an unusual transaction. The trade-off is that local differences become less visible. Start broad when screening markets, then narrow the research where the decision depends on the location of a particular home.
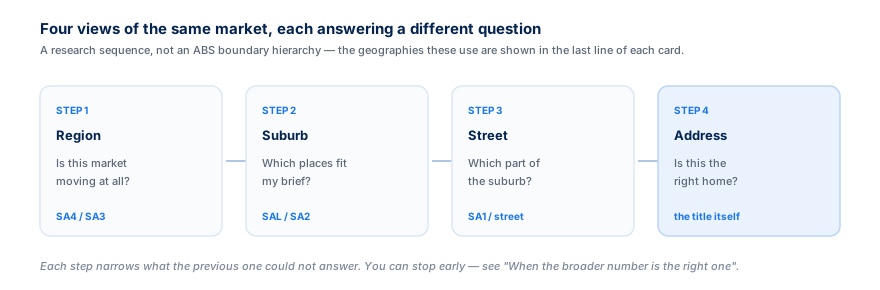
A numbered research sequence from region to home
1. Establish the wider setting
Identify the region and the market question. Keep employment, population and housing measures attached to their actual boundaries and dates.
2. Compare suburbs consistently
Use matching definitions and property types. Record missing values before building a ranking, so absence is not silently treated as a poor result.
3. Investigate differences within the suburb
Look at street and small-area evidence. Ask whether the values are observations, estimates or broader statistics assigned to smaller shapes.
4. Check the address
Confirm the property identity, inspect the records and investigate comparable sales. Carry unresolved questions into the inspection and subsequent enquiries.
ABS geography: the main statistical hierarchy
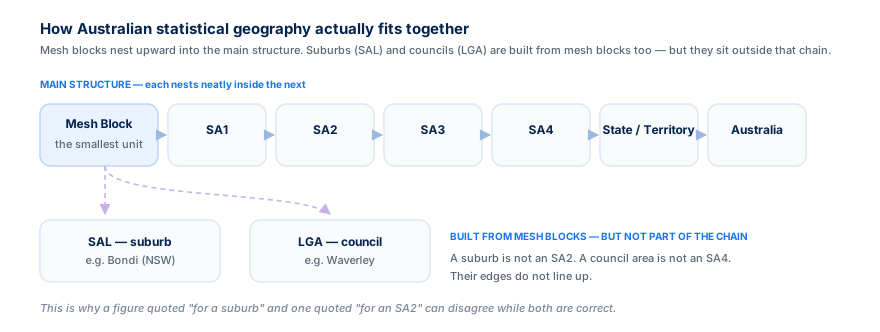
The Australian Bureau of Statistics uses the Australian Statistical Geography Standard, or ASGS. Its main hierarchy runs from Mesh Blocks through Statistical Areas Level 1, Level 2, Level 3 and Level 4, then states and territories and Australia.
These statistical areas serve different analytical purposes. They are not interchangeable names for suburbs. The ABS guide to the ASGS explains the structure and its boundary editions. Check which edition your dataset actually uses before combining it with another map.
SAL suburbs and LGAs follow separate boundaries
SAL means Suburbs and Localities. The ABS constructs these areas from Mesh Blocks to approximate officially recognised locality boundaries. They are the relevant geography when a dataset says it uses ABS suburbs.
LGA means Local Government Area. The ABS representation approximates council boundaries. SALs and LGAs belong to separate administrative geography structures, rather than slots between the SA levels.
A familiar place name does not prove that datasets cover identical territory. Keep the area code, geography type and boundary edition with the name. A mapping between areas also needs its allocation method stated, particularly where boundaries overlap.
What SA1, SA2, SA3 and SA4 are for
SA1 supports detailed Census analysis at neighbourhood scale. SA2 represents communities with social and economic connections. SA3 groups areas into regions. SA4 supports analysis of labour markets.
Those purposes explain why an SA2 name can combine familiar suburbs, while a labour-market figure describes a wider area. The ABS Census geography glossary explains how to use each level. Read a regional measure as context for a suburb, not as a direct measurement of that suburb.
A mesh block is not a household
A Mesh Block is the ABS's smallest geographic building block. It can represent residential or other land uses. It is not a property parcel, a household record or necessarily a whole street.
The ABS limits Census detail released at this scale for confidentiality and advises against analysing a single Mesh Block alone. A finely divided map therefore needs an explanation of how its values were produced.
Area demographics describe groups. They cannot identify the income, tenure or characteristics of the occupants of a particular home. Attaching an area statistic to an address does not turn it into personal information about that household.
What changes when you reach street level
A street view lets you investigate questions a suburb summary leaves open: proximity to transport, the mix of surrounding buildings, nearby development and how relevant particular sales are to the property.
But a street name is not a uniform market. Different sections can have different surroundings and housing. A long street may also cross boundaries. Check what the calculation includes before treating its headline as a description of every address along it.
In Microburbs' street-history data, the street price series is explicitly modelled, with the observed suburb median supplied as context. These are different measures. Their direction can be compared without claiming the difference is a precisely measured street premium.
What only address-level research can establish
A property record can connect a particular home with recorded attributes, sale history and valuation estimates. It makes it possible to ask whether a comparable sale resembles the home under consideration, rather than merely sharing its suburb.
Check the unit identifier as well as the street address. A building and a home within that building are different subjects. Also distinguish a listing claim from a recorded transaction and an estimate from a sale.
Address-level research still has gaps. Renovation quality, maintenance and defects may require inspection. A map and a property identifier cannot supply observations that were never collected.
Observed, aggregated and modelled data
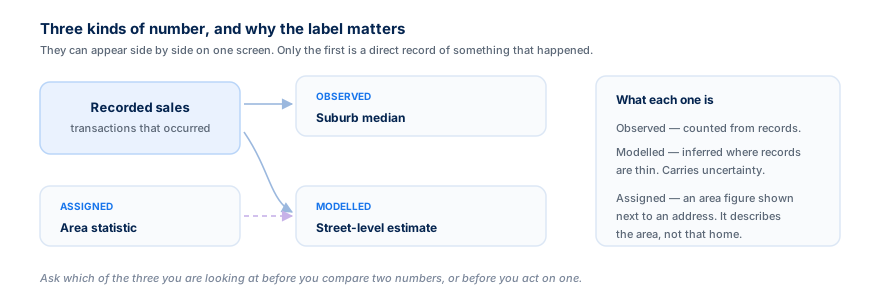
These labels describe how a value came into being. They should remain visible wherever that value is used.
| Data type | Example | What to check |
|---|---|---|
| Observed or recorded | A recorded property sale | Identity, date, source and corrections |
| Aggregated | A median calculated from selected sales | Boundary, period, property type and sample |
| Modelled | A street price history or automated valuation | Inputs, validation, uncertainty and intended use |
| Assigned from a wider area | An area statistic displayed beside an address | The original geography and assignment method |
A model can provide an estimate where direct observations are sparse. It does not create a new observed transaction. Likewise, copying a suburb value onto smaller polygons changes the display, not the information's original resolution.
Small-area detail has a cost in certainty
Restricting a sample to a smaller area can leave fewer relevant observations. Estimates may then rely more heavily on assumptions, older records or evidence from surrounding areas.
That does not make modelling invalid. It makes the method and uncertainty material to the decision. Ask how the model was tested, which properties it covers and where its errors are larger. A confidence range should come with an explanation of what it represents.
Changing boundaries can also change a result without anything moving on the ground. Keep the geography fixed for comparisons, or disclose how the figures were translated between boundary versions.
Worked example: reading Bondi at different scales
We chose Bondi, NSW because it is available through the public sandbox and lets readers repeat the geography checks. This is a worked example of interpreting coverage, not a recommendation to buy there.
Start with the returned geography
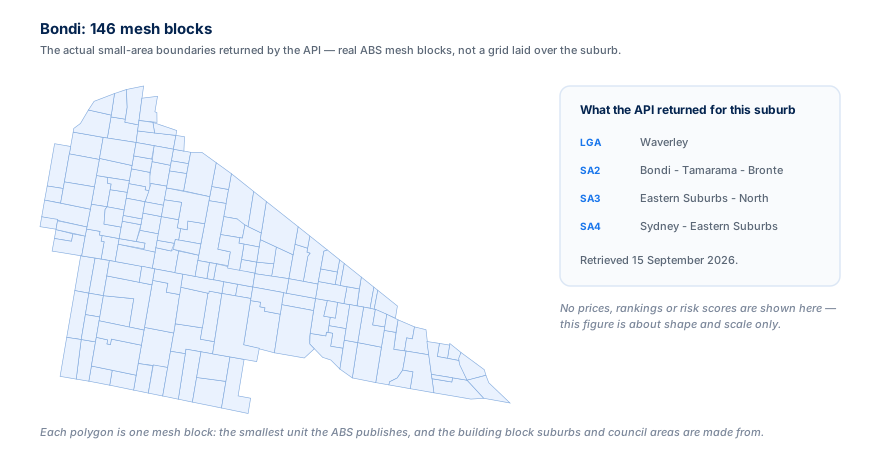
In our retrieval for this article on 15 September 2026, the suburb profile identifies Bondi's LGA as Waverley, its SA2 as Bondi - Tamarama - Bronte, its SA3 as Eastern Suburbs - North and its SA4 as Sydney - Eastern Suburbs.
The practical lesson is visible in the names: a value for the SA2 describes a differently defined area from a value for Bondi. Do not put them in the same comparison column without explaining the difference.
Look inside the suburb boundary
The Bondi mesh-block shapes response returns 146 features. We checked that the response contains 146 distinct mesh-block codes. These are mapped areas, not a count of homes, sales or independent price observations.
The shapes response supplies boundaries and identifiers. It does not supply a price or demographic measurement for each polygon. To colour those shapes by a metric, you must obtain suitable values and check their geography and method separately.
Keep the conclusion within the evidence
This example establishes that a suburb can be examined through smaller mapped areas, while sitting within differently defined statistical and administrative regions. It does not establish that one Bondi street is safer, cheaper or more likely to grow than another.
Repeat the profile and mesh-block shapes requests for Bondi using the API documentation and the sandbox bearer key test. Sandbox access is limited, so do not assume every related geography endpoint is included.
Check dates, gaps and comparison methods
A retrieval date says when you obtained a result. An observation date says when the underlying event happened. A reporting period says which interval the statistic covers. They answer different questions.
Microburbs runs a daily data pipeline. That does not mean every sale, Census measure or boundary was observed today. If dates are missing or inconsistent, resolve that before describing a figure as current.
When combining small areas, use the calculation the metric requires. Combining counts can be appropriate, but averaging area medians does not generally recover the median of the underlying records. Weighted proportions also require the relevant denominators.
Put the right level of detail into your workflow
Use suburb reports for a structured area overview, then explore Property Finder when the task moves to individual homes. With AI Chat, ask which geography, date and method support each answer.
For an app or research workflow, Microburbs API access provides the data interface. Check the published endpoint prices, create a key through the developer portal, and read the API terms before planning how to use the results. Compatible external assistants can use the MCP connection guide.
Preserve the source geography in your output. If an answer uses a suburb fallback for a missing address measure, label that fallback rather than presenting it as property-specific evidence.
Key Takeaways
- Match scale to question. Suburb screening and address assessment need different evidence.
- Keep methods visible. A modelled street series and an observed suburb median are not equivalent measurements.
- Respect geography branches. SAL suburbs and LGAs do not form intermediate steps in the SA hierarchy.
- Retain dates and gaps. A detailed map cannot repair an undocumented observation period.
- Use detail to improve the next question. It does not remove the need to check the home itself.
Common Misconceptions
“Smaller areas always give better answers.”
They give more local answers only when the underlying evidence supports that resolution. Sparse samples and model dependence can make an apparently detailed result less certain.
“Every number beside an address describes that home.”
Some describe the surrounding area. Check the source geography before interpreting them as property attributes or household characteristics.
“A rising suburb median means this home rose by the same amount.”
The mix of transactions may have changed. Investigate relevant property evidence before translating an aggregate movement into an individual valuation.
Continue reading: choose the next research question
- Questions to ask an Australian property data API helps you assess a data service before building around it.
- Trying an Australian property data API for free explains the sandbox route.
- What an MCP server does for property research explains the connection to external assistants.
- Using Microburbs AI Chat gives examples of questions to investigate in conversation.
Frequently Asked Questions
What is property data granularity?
It is the level of detail at which property information is recorded, calculated or displayed. Always check whether a value describes a region, suburb, street, small statistical area or individual property.
Is an SA2 the same as a suburb?
No. SA2 and SAL are different geographies. An SA2 may group familiar suburbs, while SAL approximates recognised suburb and locality boundaries. Match geography types before comparing values.
Is street-level price data always based on actual sales?
No. A street series can be modelled. Microburbs labels its street price history as modelled and supplies the observed suburb median separately as context. Read the definition before calculating a street premium.
Can mesh-block demographics tell me who lives next door?
No. Area statistics describe groups and cannot establish the characteristics of a particular household. Keep personal conclusions out of aggregate demographic analysis.
Where should I start?
Start with the question your purchase depends on. Use the suburb for context, investigate the street and then verify the address. Keep the boundary, date and method beside every figure you rely on.



![Australian Property Data MCP Server: Connect Claude, Free [2026]](/_next/image?url=%2Fimages%2Fblog%2Fblog-ai-tech.jpg&w=3840&q=75)